

The ability to create custom build report templates which present an analysis of specific quantitative and qualitative data is key to progressing your business's efficiency.
HubSpot has been assessing the formatting options and cross object report options which allow you to compare and contrast the strengths and weaknesses of your multiple data sources relevant to your business.
The BETA custom report builder enables you to understand the factors affecting the day to day workings of your business through key data trends. Creating concise, useful reports is a skill, learnt through experience and developed with the help of intuitive software. HubSpot has put in all the hard work to enable you to understand what works and what doesn't when it comes to the optimum ways of presenting data. There are some things, however, HubSpot needs you and your team to quantify and forward plan before you get started.
To enable you to establish relevant, effective reporting for your business, it is essential that you identify the goal of your analysis, the sources of the most useful data available to you and how best to present this data in terms of the format you use for your reports.
First things first
Create a blank report and then customise it. Head over to your HubSpot account and click Reports. Then switch over to the upper right side of this page and select 'Create Custom Report', then select 'Custom Report Builder' from the menu.
The right side options which are presented allow you to consider the data sources appropriate for your future custom-built report. Here you can select up to four secondary data sources as well as one primary data source.
Using intuitive automated data selection techniques, HubSpot scans data sources and selects the most relevant and useful information. These primary sources are presented as a shortlist. Those, 'all filler, no killer' secondary sources are fazed out to stop data lists looking overwhelming and too information-dense. HubSpot recognises when no useful associations exist between primary and secondary data sources. Equally, if one source replicates another, without any robust advantages to a known primary, then again this is greyed out.

Next, let's name the report
Click Next. Use the edit icon, symbolised by a pencil, to edit the title of the report. Use the undo, redo icons to reconsider new ideas you try on throughout your report building process. To view the actions taken to customise the information, click 'List View History.'
It's possible to preview the updated preview chart as you work, use the refresh button to update the data to your new parameters manually.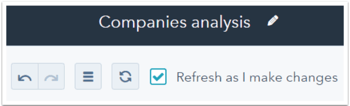
The raw data tab allows you to oversee the data from the fields you've added to the 'Available Fields' section.
Now, let's learn to add fields to the report
Event fields, which include values in your contact properties, event data and miscellaneous information interlinked with the data sources you add, are all options to consider including in your report. At present, only one event field limited to a specific time frame is automatically option-able for the custom report. Once these fields are added, the report will be able to analyse data from the specific property values and event data.
Head over to the left panel, select the 'Data Source' dropdown and add in the data source to the appropriate field. Edit the data sources as frequently as required to update those which have been selected.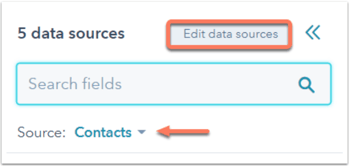
In the left panel, click the Data Source dropdown menu and select the data source with the field you want. All fields are alphabetised, to make scrolling and selecting easier. Simply hold down, click on required field and drag to add. These will be added to the 'Available Fields' section. You can also drag and drop the field to the right.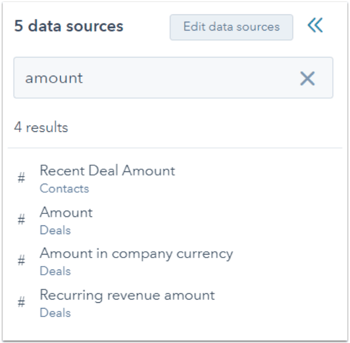
Next up comes the manoeuvrability and aesthetics of your data's display options
Consider the most readable way your data can be committed to a chart and display type. Click first to hide the left panel and last to expand it again.
Are you more comfortable with doughnut or line charts? The 'configure tab chart' section allows you to peruse HubSpot's chart features to work out how you want your data displayed. There is no wrong or right way here; Work with how your brain understands your quantified data at its simplest. Experiment and discuss these charts with your team; It is always interesting to get different takes on the strengths and weaknesses of data charts. Finally, you are able to preview how finished product data when clicking the preview report option to the right of the page.
Click and hold then drag into various fields to think through appropriate sections. The possible sections can be displayed:
- X-axis: the horizontal line in the report.
- Y-axis: the vertical line in the report.
- Break down by: the sections or categories in the report.
- Values: the amount, quantity, or value of the report (i.e., what is being counted).
- Group by: the sections or categories in the report. This is for the text chart type.
- Columns: the columns in the report. This is only for the table chart type.
Customise your filters
'Avoid being overwhelmed by useless data' is rule 101 of custom report builder. Finely tuned filters limit data by providing conditions for detail specific data being enabled to enter the report and subsequently analysed.
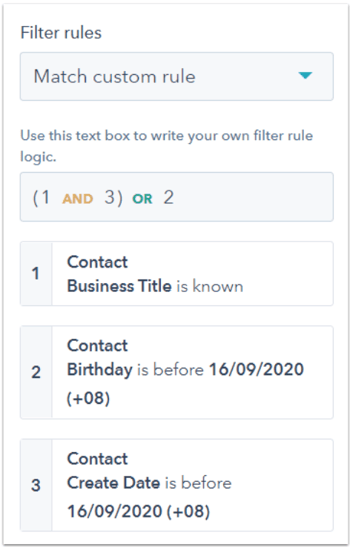
Be sure to match all conditions and custom rules. You are able to set custom rules by using filter numbers and operators. Select Match custom rules to reveal filter numbers. Each filter is then labelled by a number which descends numerically. For example, you can enter (1 AND 3) OR 2 to include data that adheres to either both filter 1 and 3 or filter 2.
To create a filter:
Select a field; these will be the filters which are now added to your report
Click a field below. These are fields you've selected to be filtered or added to the report. 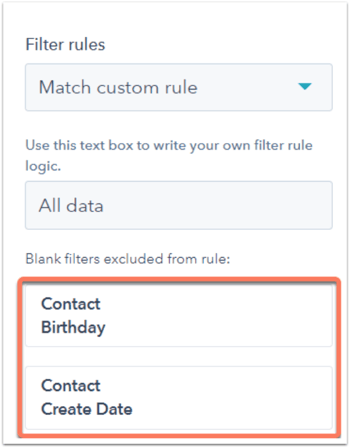
Decide on a condition for the selected field and then select the value for the condition.
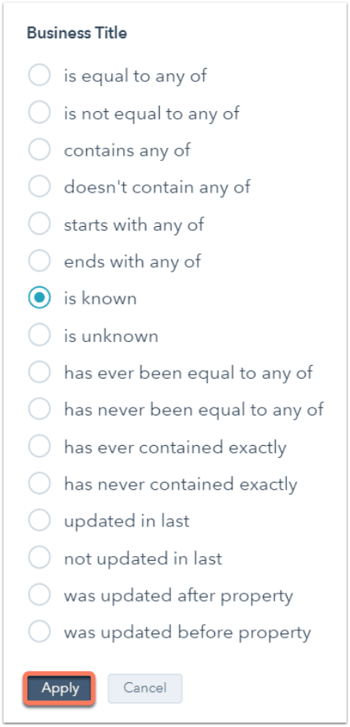
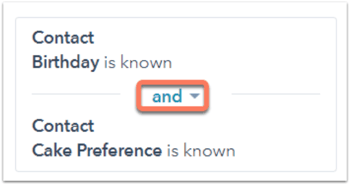
You can then use this as a calendar picker or a dropdown menu to which you add a value. Once selected, this will automatically be used as 'data at source' value. Merge filters together if there are any previously existing filters. This can be amended by selecting the group associated with another filter dropdown menu. You are able to enter the filter number you want to pair this group filter with.
To update the operator within the group, click the and text in the group and select.
Save the report.
Now that you have completed the report, saving it in its entirety is critical. Further amendments can be made at any stage. Select the save option located in the upper right quadrant of the page. Each time you do this it will update the current report, you will be able to change the name of the report. There is no need to add this latest version to the Dashboard
Finally, if this is an existing report, you can edit the report name.
If it is a new report, enter the report name and select where you want to add the report to:
To select the Dashboard in order to add the report to it, click the dropdown menu. Later you will be able to edit the most current report via the Dashboard or the reports list.
Et voila, creating custom-built reports with HubSpot is that simple!


Stay Ahead with Method
Join our community of forward-thinking professionals. Subscribe to receive the latest insights on marketing, design, and innovation directly to your inbox.